
Air Sealing – Seven Times Better than Code: The current building code requires new houses to be tested for air tightness (see Note 1 below for details). Current code allows up to 3 ACH50. The Passive House standard allows only 0.6 ACH50 – five times as tight. When we measured the Demonstration House, it measured just 0.42 ACH50, which we attribute to a combination of careful design and excellent workmanship.
Energy Star® Certification – 18 Times The Required Energy Savings: 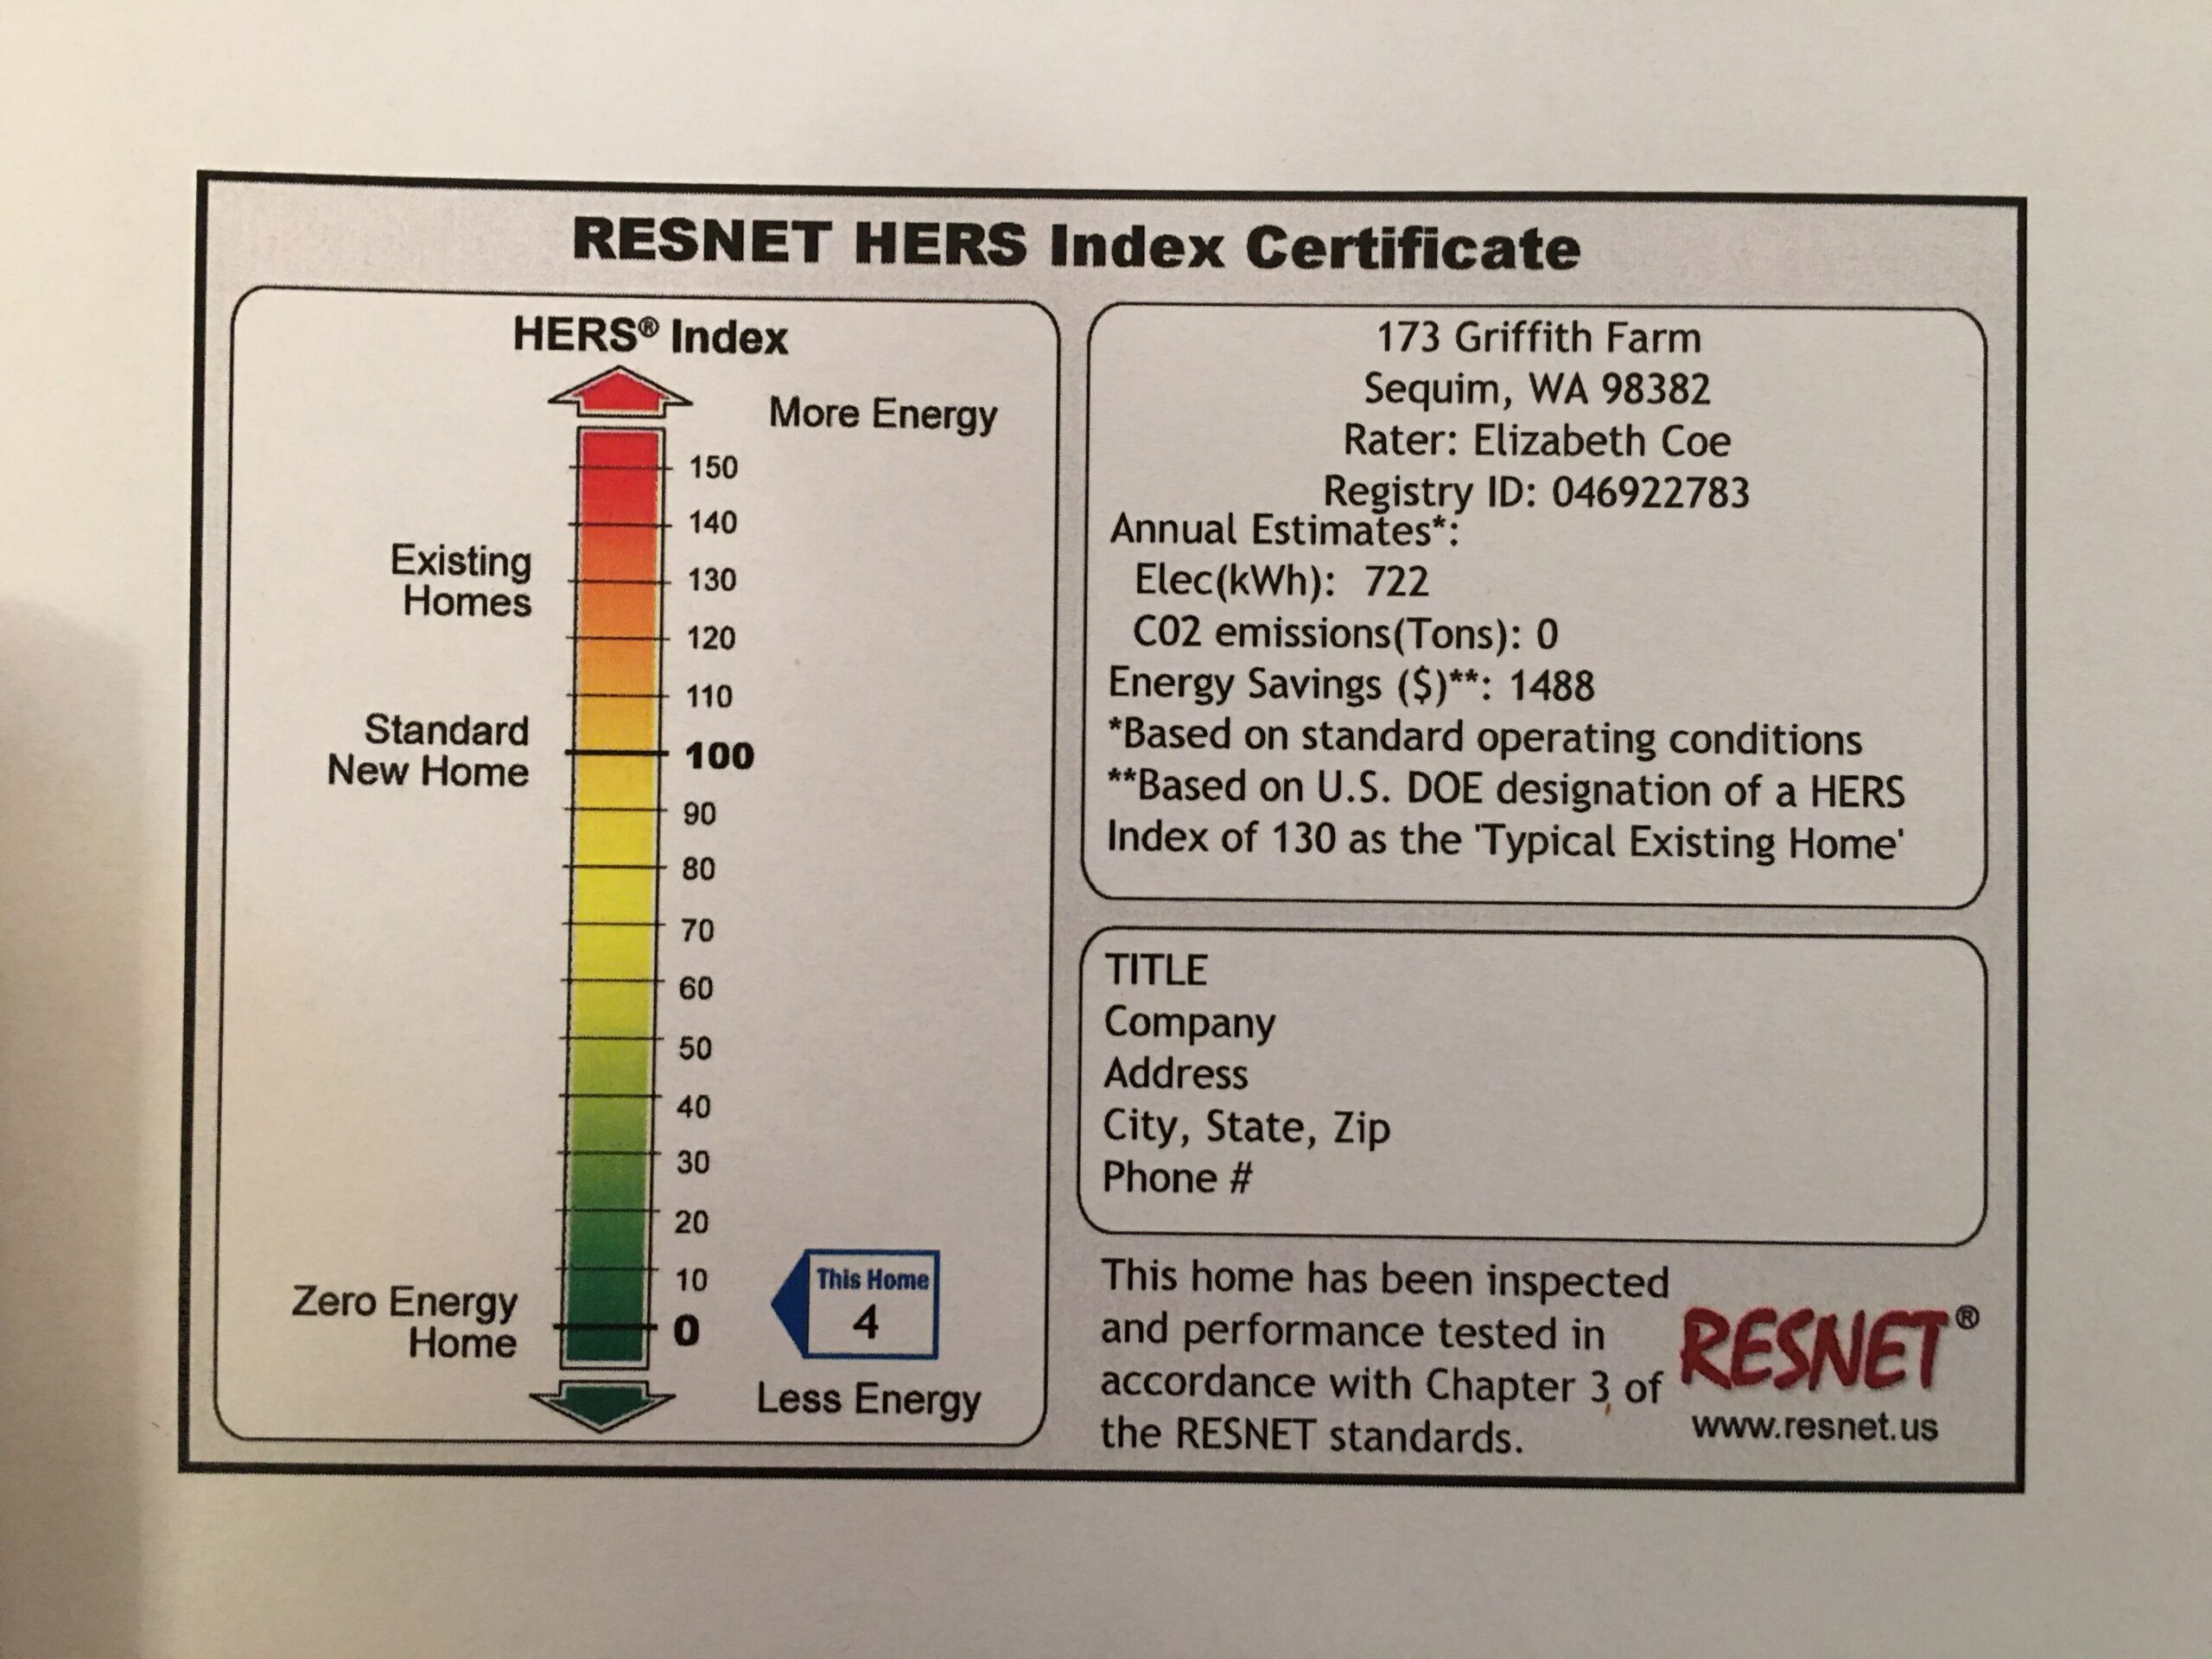 The US. Environmental Protection Agency (EPA) Energy Star® program is well known for its ratings of the relative efficiency of appliances. When we found out that they also rate homes, we applied for certification.
After a day-long on-site evaluation, they awarded us a certificate with an estimated energy usage of just 38% of a standard new home of the same size (not including solar) and just 4% when the solar system is included. This was very close to our own estimates and exceeded the Energy Star minimum requirements (73% as much energy as allowed by current code vs our 4%.)
 Net Zero – Excess Power Generated Every Year: From the day the house was completed, the solar system has annually generated more energy than the entire property (including outbuildings and car) consumes.
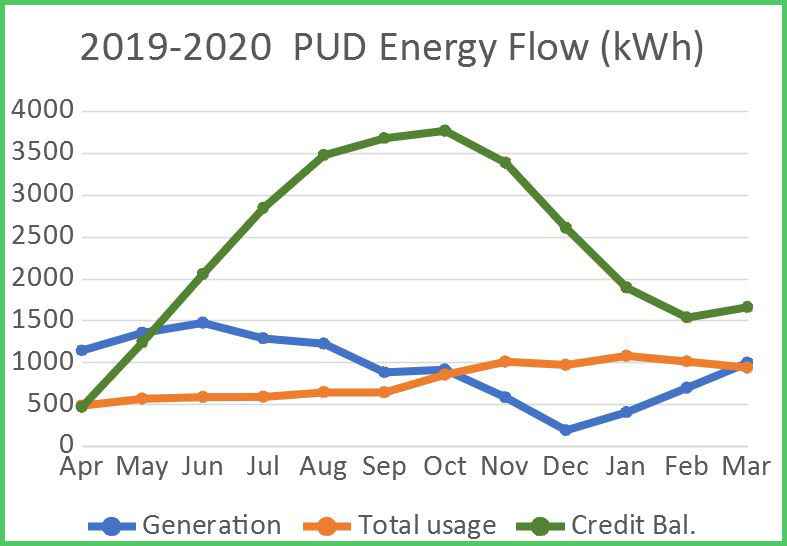
The PUD does not give credit for over-production at the end of its annual cycle each March 31, but the Washington state incentives in place when the solar was installed pay for total generated so the overproduction still produced revenue for us.
The graph shows the energy generated and used each month and the energy credit balance that builds up during the summer months and then is drawn down in the cloudy winter months. At the end of the cycle shown, we had produced 1663 kWh more energy than we used.
Solar Production – More Than Estimated Every Year: The solar system exceeded the estimated energy production by 2.8% in 2018, 6.9% in 2019, and 5.1% in 2020.
Total House Energy Consumption: We estimated that the house (not including the vehicle or any outbuildings) would require 7704 kWh/year of electrical energy. The EPA independently estimated that it would require 6859 kWh/year without the solar system. In 2018 the house had a single occupant, was heated to 68 degrees, and consumed 4859 kWh. With two occupants and heated to 70 degrees in 2019 that increased to 6560 kWh. In 2020, with the internal temperature set to 72 degrees and also selectively heating the sunroom in the winter with a conventional electric heater the consuption increased to 8078 kWh (see note 2 below)
Heating and Cooling Energy Consumption — Well Below Estimates: We estimated that heating and cooling the house would require 2966 kWh of energy each year, costing an average of $17.30 per month (at $0.07/kWh) if there were no solar system. To our surprise (and delight) the average monthly cost would have been just $6.53 per month in 2018, increasing to $9.35 in 2019 and to $10.87 per month in 2020. This illustrates the dramatic effect of heating to a higher internal temperature in the later years.
We attribute that difference between estimated and actual consumption to two factors:
The heat contribution from the sun room during the spring and fall months
The day-night averaging effect of the slab floor.
Hot Water Energy Consumption – Well Under Manufacturers Estimates: Our A.O.Smith heat pump water heater is estimated by the manufacturer to use 1464 kWh of electricity per year, but has used less than half of that (see Note 3 below). The cost without solar would have been $3.75/month in 2019, which is very close to the EPA’s estimate of $3.83/month.
Lighting – Cheap to run and maintenance-free: Although we do not measure the energy use for lighting, we know that LED lights use a small fraction of the energy used for conventional incandescent lamps. Furthermore, they are essentially maintenance-free – in the three-plus years since the house was completed we have not had to change a single lamp.
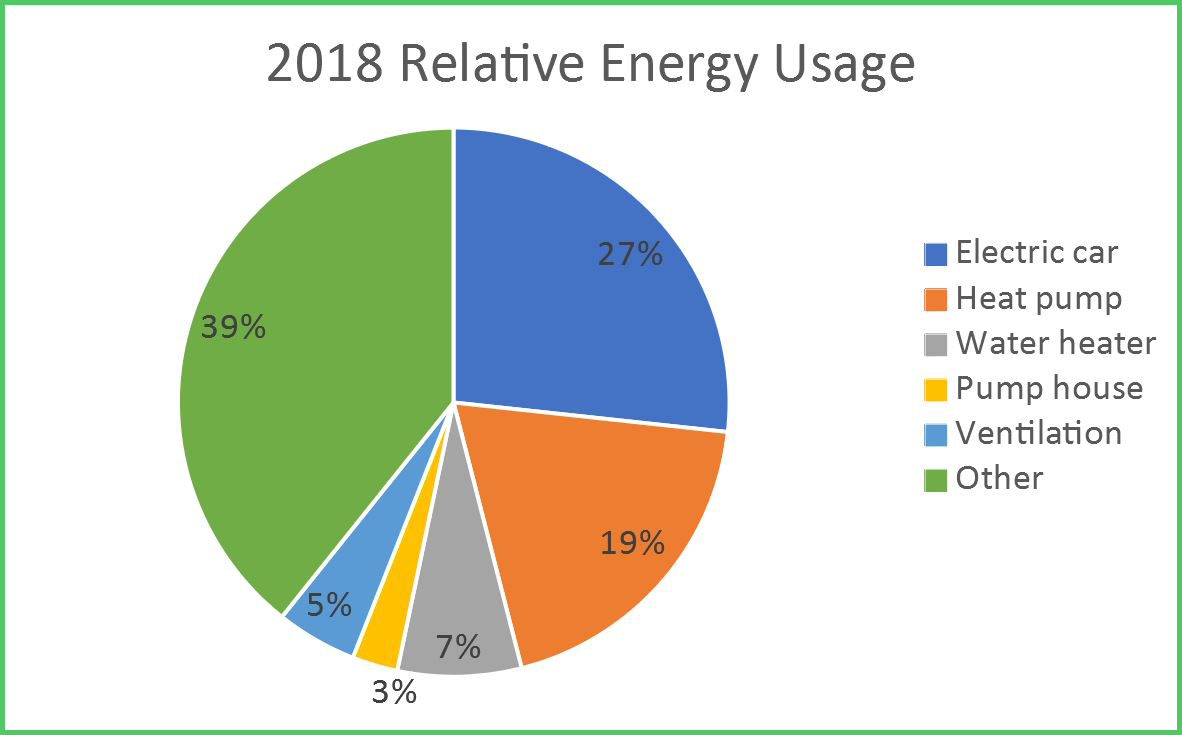
Appliances – Harder to Reduce: Having greatly reduced the energy required for heating, cooling, and hot water, the remaining energy consumption of the house is dominated by the large appliances (“other” on chart). Our wall ovens and clothes dryer are the biggest energy hogs in the house when in use. The large refrigerator and upright freezer (both Energy Star® rated) don’t use a lot of power, but run frequently, so the total is noticeable.
We are planning to increase the amount of laundry that gets dried naturally by building retractable clothes drying racks in the sunroom – stay tuned.
Comfort – Better than Expected: Building an energy-efficient home has major benefits in livability:
The floors feel warm, even with bare feet, because their temperatures stay within about one degree of room temperature, even with near-freezing outside temperatures.
There are no cold drafts due to tightly-sealed windows and doors, and the triple-glass in the windows.
There is no condensation on the bathroom mirrors and windows after a shower because the ventilation system removes the damp and because the window inside temperatures is within five degrees of room temperature.
External noises are barely audible due to the thick, insulated walls and ceiling and the better sound attenuation of triple-glass windows.
Ventilation is virtually silent — the heat recovery ventilation system is far quieter than typical kitchen and bath exhaust fans.
Heating is virtually silent – mini-split heat pumps are designed to run a higher percentage of the time than a conventional heat pump or electric furnace, but with the inside unit having a lower air speed, and thus much quieter operation.
Interior temperatures stay more constant, due to the “flywheel” effect of the slab floor.
Notes:
The test consists of pressurizing the house to 50 Pascals (about 1 pound/square foot) and then measuring how much air has to be pumped into it to maintain that pressure. The result is expressed in air changes per hour – in other words if the air flow required to maintain 50 Pascals of pressure would be enough to replace all the air in a house in one hour, then the leakage is 1. This would be expressed as 1 ACH50.
These figures are somewhat inflated because they include the garage and woodshop (our energy monitoring system unfortunately does not yet allow us to track the house usage by itself.)
In 2018 it used just 535 kWh (with single occupancy), increasing to 643 kWh in 2019 – both less than half the estimate.